It’s the last quarter of the year 2020, and the crypto market enters a slowing phase. The question in the minds of traders and investors is, “is it still possible for me to earn money by trading Bitcoins now that the year is coming to a close?” Well, the answer is, “Yes, you can still make money trading the number one crypto asset Bitcoin BTC in 2020”.
However, to do that, we have to look into the recent events in the crypto space (DEFI), BTC miners’ reward, a top down trend analysis of the BTCUSD from the monthly chart to the daily.
You May Like: Trade bitcoin with leverage on BTCC bitcoin futures trading platform, and with $100 you’d be capable of trading up to $15,000 bitcoin.
DeFi and Bitcoin
Traders and investors appear to be turning their attention to Bitcoin BTC following a 72.38% and 55.73% slump in the price of DeFi tokens like YFinance (YFIUSD) and AAVE (LENDUSD) from their $44026.164 and 0.90839177 high respectively on 01-09-2020.
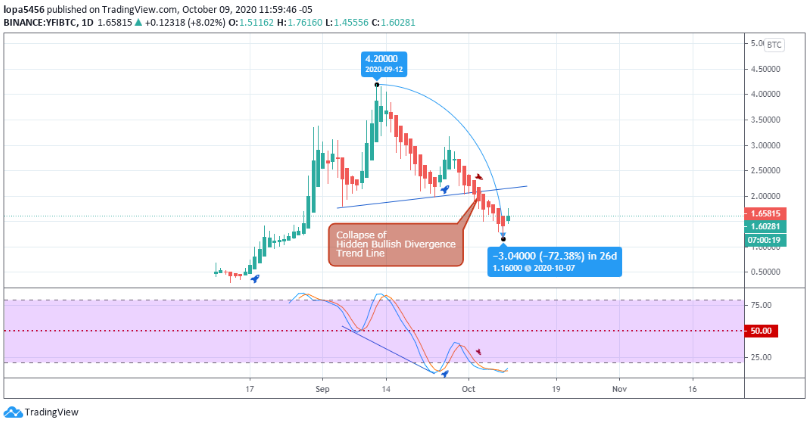
The YFIBTC chart above shows a massive exodus of investors’ funds into the BTC, as the price chart exits the overbought area by 72.38%.
Hopes for a price recovery in the YFI token from the hidden bullish divergence setup on 25-09-2020 were dashed, following a bullish trend line collapse.
The BTCUSD, on the other hand, shows vital signs of completing its’ correction phase and finds support above the $10K round-number support. Let’s dive into the charts and identify significant chart patterns and levels likely for a possible BTCUSD rally.
BTCUSD MONTHLY TF
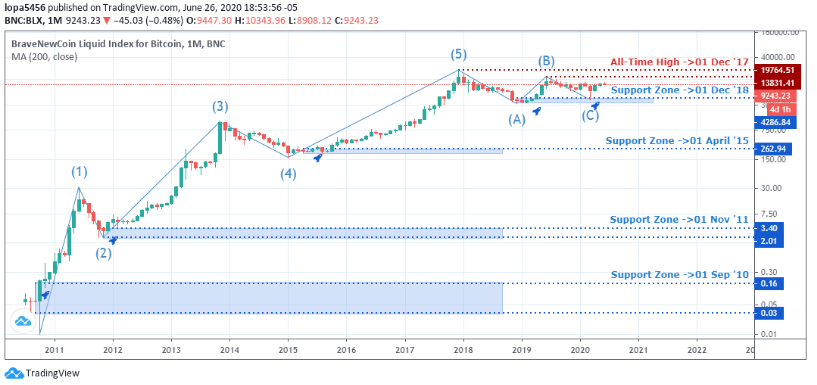
The above monthly chart of the BraveNewCoin Liquid Index for Bitcoin BTC shows the BTC’s entire trend cycle paired against the USD.
Bitcoin BTC, the pioneer crypto asset, has been in a bullish trend since inception, completed the fifth wave in a first and significant impulse wave on 01 December ’17, where it established an all-time high of $19764.51.
Upon completing the fifth wave count in an Elliot wave structure, the BTCUSD moved on to end a significant A-B-C correction wave after bouncing off a significant support zone at $4286.84.
With that said, the top-dog crypto asset is ready to resume the dominant bullish trend cycle after establishing a bottoming of the significant corrective wave.
Next, we zoom down to the weekly chart to get an idea of the patterns driving the exchange rate at that level.
BTCUSD Weekly TF
Bullish accumulation candlestick patterns formed between 23 March ’20 to 13 April ’20, setting support levels at $5732.92, and $6482.35 reinforced the bullish momentum till the pair entered the overbought area of the stochastic oscillator.
Upon a break out of consolidation on 20 July ’20, the BTCUSD went ahead to set a new resistance level at $12473.00 and corrected the gains back to test the consolidation area.
The most recent chart pattern established on the weekly time frame is the hidden bullish divergence formation, signaling a bullish trend.
Although the stochastic oscillator has already confirmed a golden cross of the %K and %D, a price close above the $10945.21 support area should boost confidence to scale into the upward price momentum.
BTCUSD Daily TF
The hidden bearish divergence setup on 20 September ’20 signaled a sharp price slump as the bears drove the pair out of the overbought area.
Failure to continue the price slump saw the BTCUSD enter a range-bound market structure and later, an exit of bearish accumulation resistance and trend line resistance for a continuation of the bullish trend.
You May Like: Trade bitcoin with leverage on BTCC, and with $100 you’d be capable of trading up to $15,000 bitcoin. Up to 2,000 USDT deposit bonus available now!
MIREV Monthly TF
Miners get incentivized to secure the BTC network and transactions. They act in a way that’s similar to traditional central banks.
A decline in miners’ reward implies a lack of confidence on the part of miners to hold on to Bitcoin BTC; thus, they sell off a part of their BTC holdings to cover up for mining costs.
The above chart clearly shows an increase in miners’ reward after coming in contact with the 50-month Moving Average.
The chart also clearly identifies a similar bearish accumulation pattern, showing exhaustion in the corrective waves, and an impending breakout of the bearish accumulation resistance on 01 November ’11 and 01 March ’15.
Do you notice a similar bearish accumulation resistance price formation on 01 March ’19 and 01 June ’20?
Well, a likely close in the value of the MIREV from the monthly chart perspective should get the price set for a bullish price surge in the BTCUSD that can be likened to the 01 March ’15 chart structure.
MIREV Weekly TF
The miner’s revenue already closed above a bearish closing inside the bar on 22 June ’20. A breach above the MA-50 and MA-200 should serve as confirmation to the upside as the BCHAIN/MIREV struggles under both Moving Average levels.
BTC In the News
Recently, there’s been an upshoot in the number of new Bitcoin BTC addresses, and analysts speculate on China’s development of its Central Bank Digital Currency. With that said, we should expect new money coming into the crypto space and an increase in demand in the BTC before the year comes to a close.
Also, in the news, there are speculations of PayPal following a similar step to Square in the adoption of Bitcoin.
Squares’ decision to fully embrace Bitcoin by enabling BTC payments in their CashApp and purchasing about $50 million in its balance sheet has seen the company leaving PayPal in the dust.
Mike Novogratz, Galaxy Digital CEO, and Andy Edstrom of WESCAP believe that PayPal having more customer base than Square may also want to partake of the BTC demand and move in that direction.
They think it to be major anticipated news compared to other events this year.
Conclusion
Although the long term and upside overview of the Bitcoin BTC charts are considered in this post, traders can still look into trading opportunities that present more of a short term holding of the crypto asset.
It’s always the best approach to trade with sound risk and money management principles when trading the BTCUSD on leverage.
About BTCC: BTCC is a 9-year-old crypto exchange and now provides bitcoin leverage trading and the total trading reached 98 billion USDT contracts in the last 30 days, especially in the Korean crypto market (비트 코인 선물).