If you’ve been involved in the financial markets for any length of time, you’ll know the universally accepted truth that no one can 100% accurately predict the future movement of any financial security.
To compensate for this, one technique used by investors is technical analysis to help them predict where the price will go. Technical analysis relies on indicators, which are created using mathematical computations to predict future movements.
The main types of technical indicators are trend, oscillators, volume, and others. This article will explain the most common and most efficient trend indicators in the market, so you can apply them to your own trading.
Moving Averages
Moving averages are created using the mathematical concept of averages. In averages, you add all the numbers and divide the total with the periods. In trading, there are four main types of moving averages, which are simple, weighted, exponential, and smoothed. These averages are not used to predict the direction of an asset. Instead, they are used to define the current direction.
The most common type of moving averages is the simple moving average (SMA), which is calculated by adding all the daily closing prices and dividing it with the number of periods. The Exponential Moving Average (EMA) is also commonly used and is calculated by first calculating the SMA, and then calculating the weighting multiplier, and then calculating the EMA for each day.
As a trader, you are not required to master these calculations. All you need is to know how to use the moving averages when trading. While there are a few ways, many prefer using the crossover EMA crossover because it is usually faster than the SMA. Using the crossover, you apply a longer-timeframe EMA and a shorter EMA. When the longer-timeframe EMA crosses the shorter timeframe going up, it is viewed as a bullish signal. A bearish signal emerges when there is a crossover of the two averages heading downwards.

Bollinger Bands
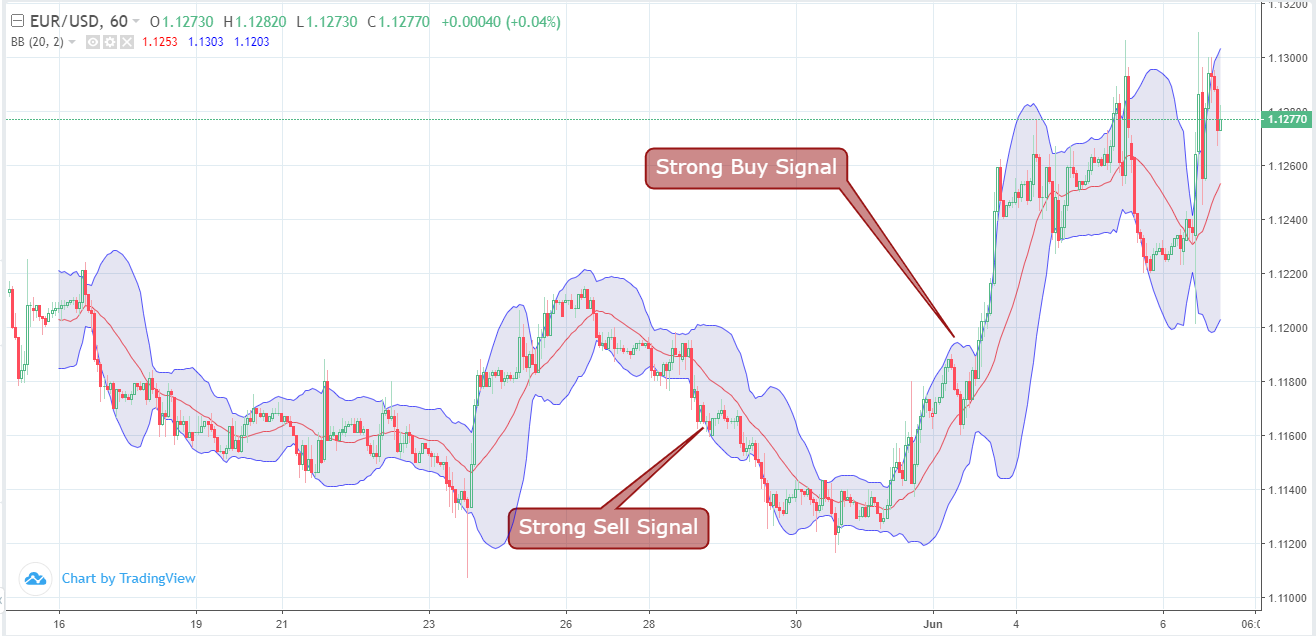
Bollinger Bands are trend indicators that are placed above and below a moving average. The middle line of the Bollinger Band is the simple moving average of the asset, while the upper and lower bands are standard deviations of the asset. Normally, they are set to 2, but they can be adjusted depending on your trading strategy.
Traders use the Bollinger Bands in several ways. Some use it to identify the W-Bottoms and M-Tops. Others tend to place buy trades when the price touches the lower band and sell trades when it touches the upper line. However, another method is to do the opposite. As shown below, when the price is moving along the upper band, it is usually a signal that the trend is strong and could continue. When the price is moving along the lower band, it is usually a signal that the downward trend is strong, which is a signal to sell.
Average Directional Index (ADX)
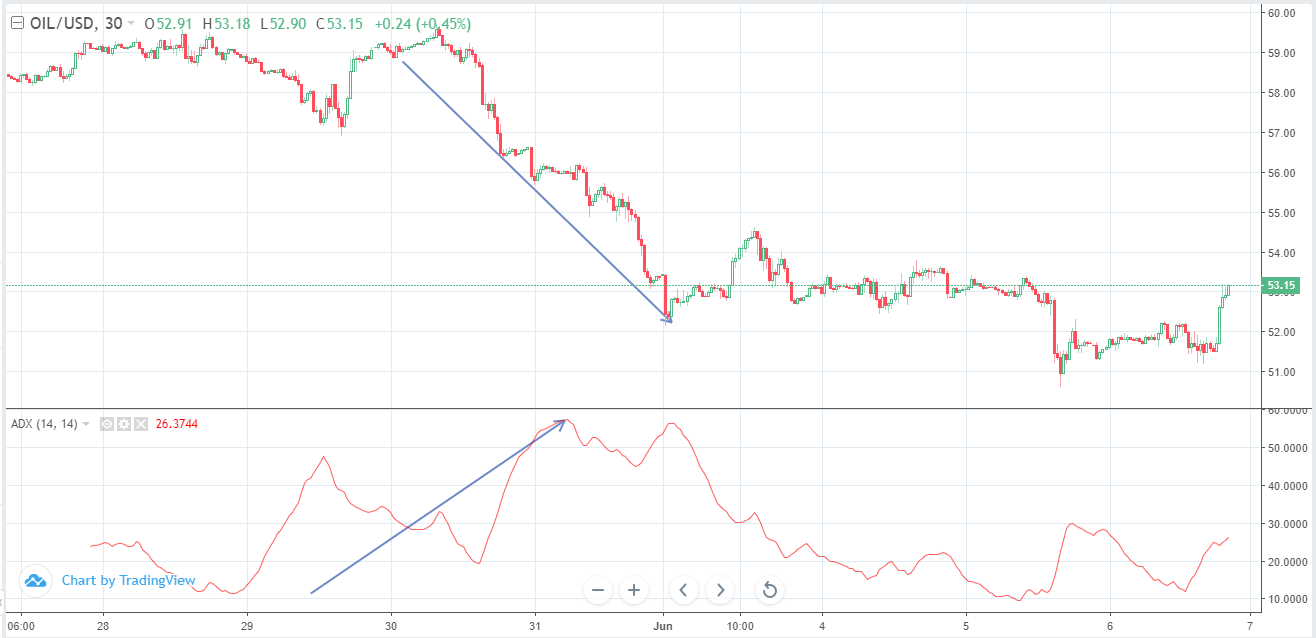
ADX is made up of two parts. The plus directional indicator (+DI) and the minus directional indicator (-DI) are developed from the smoothed averages of the differences. They measure the direction of the trend over time. The ADX on the other hand is derived from the smoothed averages of the difference between +DI and -DI. By combining the +DI, -DI, and ADX, one can measure the strength and the direction of the trend. To interpret the indicator, a trend is seen when the ADX is above 25 and no trend is when the ADX is below 20.
Parabolic SAR
Parabolic SAR is classified as a lagging indicator because it trails the price of the asset over time. While calculating the index is complex, you are only required to know how it is interpreted. As shown below, in a downward trend, the dots of the Parabolic SAR are usually in the right side. In an upward trend, the dots are usually at the lower side. To use it effectively, it is recommended to combine it with other oscillators or other trend indicators.

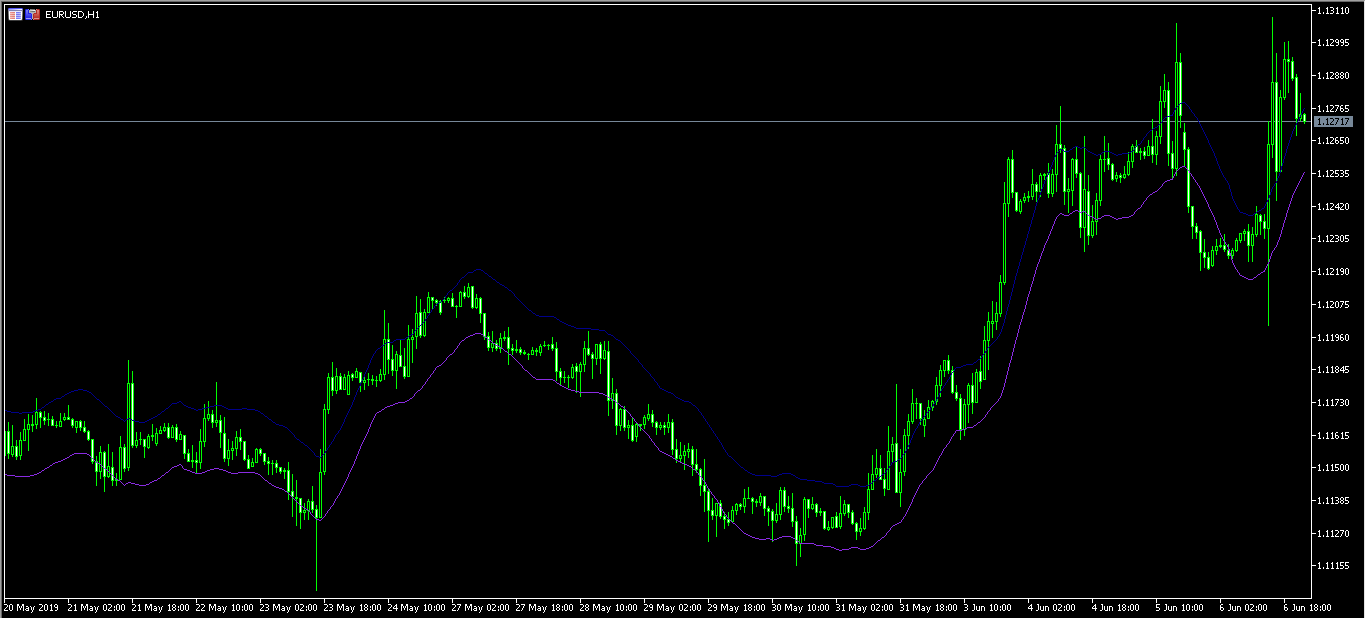
Envelopes
The envelopes indicator is formed with two moving average. One of the averages shifts upward and the other downwards. The selection of the best number of bands is determined by the volatility of the market. As shown below, signals to sell an asset emerge when the price reaches the lower margin of the band, while signals to buy emerge when the price trades along the upper band.
Final thoughts
Using trend indicators is a simple process. However, you need to keep a few points in mind. First, they usually work well when the price is either trending upwards or downwards. You should not use them when the market is trading in a sideways pattern. Second, it is recommended that you combine them with other indicators like oscillators and volumes. Third, you should adjust the periods depending on your trading strategy, which you can find an overview of here. For example, if you are a day trader, it would not make sense to use a 100-period when using moving averages.